✨ Introduction
The goal was ambitious but clear—to achieve a throughput of 100,000 processed Pub/Sub subscription messages per hour. Each message batch we receive contains roughly 250 messages, so this was a substantial task.
Our service consumes messages from a topic owned by another service, and all our deployments are managed via GitOps charts. This means any changes to our configuration need to be templated with Helm. Here’s a breakdown of the key adjustments we made to hit our target.
- Pub/Sub Configuration ⚙️
The first thing we looked at was how our service was pulling messages. We found that previous configurations were using a ratio-based approach, which was less precise for our specific workload. We decided to simplify and directly set the number of parallel pull threads.
Before: We had these parameters that were removed from our configuration:
| |
After: We replaced them with a direct count parameter. While the application’s default was 10, we found that a value of 15 was more effective for our needs.
| |
- Fine-tuning Resource Limits 💾
A common pitfall is over-provisioning resources, leading to unnecessary overhead. Our staging environment had much higher resource limits that weren’t being fully utilized. We decided to right-size these limits to be more cost-effective.
The configuration we settled on:
| |
By setting both requests and limits to the same value, we ensure the Kubernetes scheduler gives our pods exactly what they need without wasting resources.
- Optimizing Horizontal Pod Autoscaling (HPA) 📈
To handle traffic spikes and dips, we needed intelligent autoscaling. Our goal was for the service to scale up immediately when a large batch of data arrives, but to scale down more slowly to avoid a race condition where a new batch arrives just after pods are terminated.
We achieved this by adjusting the stabilizationWindowSeconds for both scaling up and scaling down in our HPA definition.
The HPA behavior we added:
| |
This configuration tells our HPA to scale up instantly (stabilizationWindowSeconds: 0) as soon as the CPU threshold is breached, but to wait for 8 minutes (stabilizationWindowSeconds: 480) before scaling down. This prevents thrashing and ensures the service is ready for subsequent large batches.
This was easily implemented by adding the behavior section to our Helm chart’s values.yaml file:
| |
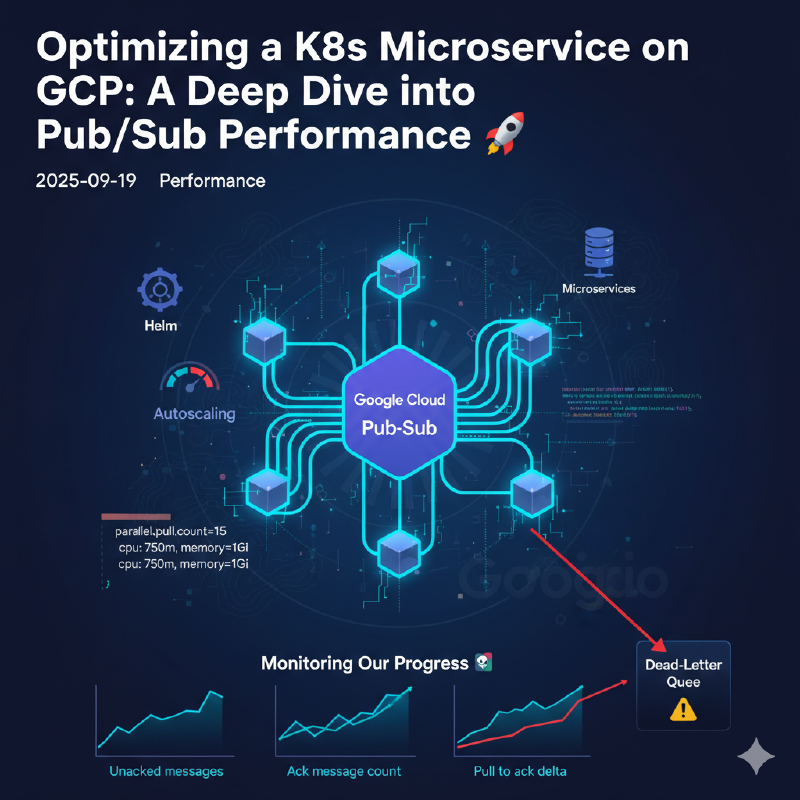
Monitoring Our Progress 📊
During this process, the most useful GCP Pub/Sub subscription charts for monitoring our progress were:
- Unacked messages by region
- Ack message count by delivery type
- Pull to ack delta
- Expired ack deadlines count
- Delivery metrics
These charts gave us crucial insights into how our changes were impacting message throughput and overall system health in real time.
The Missing Piece: Dead-Letter Queues ⚠️
We also found a significant issue during this fine-tuning: our subscription does not have a dead-letter queue (DLQ) configured. A dead-letter queue is a separate topic or subscription that stores messages that a service has failed to process successfully after a certain number of delivery attempts. It prevents “poison pill” messages from perpetually failing and blocking the main subscription queue.
The next step in this project will be to create a dead-letter policy for the subscription, including a dedicated dead-letter topic and a corresponding subscription. This will give us a place to inspect and manually handle messages that cannot be processed, improving the robustness of our service.
Final Thoughts & Caveats 🧐
While these changes helped us achieve our performance goals and made the service more cost-effective, it’s important to note that other bottlenecks still exist within the service itself. This solution represents the best and most cost-effective option we’ve found so far by external fine-tuning. It’s a great example of how a few key configuration changes can make a huge impact on both performance and resource utilization.